
@ Michael Snoyman
2025-02-04 08:29:00
President Trump has started rolling out his tariffs, something I [blogged about in November](https://www.snoyman.com/blog/2024/11/steelmanning-tariffs/). People are talking about these tariffs a lot right now, with many people (correctly) commenting on how consumers will end up with higher prices as a result of these tariffs. While that part is true, I’ve seen a lot of people taking it to the next, incorrect step: that consumers will pay the entirety of the tax. I [put up a poll on X](https://x.com/snoyberg/status/1886035800019599808) to see what people thought, and while the right answer got a lot of votes, it wasn't the winner.

For purposes of this blog post, our ultimate question will be the following:
* Suppose apples currently sell for $1 each in the entire United States.
* There are domestic sellers and foreign sellers of apples, all receiving the same price.
* There are no taxes or tariffs on the purchase of apples.
* The question is: if the US federal government puts a $0.50 import tariff per apple, what will be the change in the following:
* Number of apples bought in the US
* Price paid by buyers for apples in the US
* Post-tax price received by domestic apple producers
* Post-tax price received by foreign apple producers
Before we can answer that question, we need to ask an easier, first question: before instituting the tariff, why do apples cost $1?
And finally, before we dive into the details, let me provide you with the answers to the ultimate question. I recommend you try to guess these answers before reading this, and if you get it wrong, try to understand why:
1. The number of apples bought will go down
2. The buyers will pay more for each apple they buy, but not the full amount of the tariff
3. Domestic apple sellers will receive a *higher* price per apple
4. Foreign apple sellers will receive a *lower* price per apple, but not lowered by the full amount of the tariff
In other words, regardless of who sends the payment to the government, both taxed parties (domestic buyers and foreign sellers) will absorb some of the costs of the tariff, while domestic sellers will benefit from the protectionism provided by tariffs and be able to sell at a higher price per unit.
## Marginal benefit
All of the numbers discussed below are part of a [helper Google Sheet](https://docs.google.com/spreadsheets/d/14ZbkWpw1B9Q1UDB9Yh47DmdKQfIafVVBKbDUsSIfGZw/edit?usp=sharing) I put together for this analysis. Also, apologies about the jagged lines in the charts below, I hadn’t realized before starting on this that there are [some difficulties with creating supply and demand charts in Google Sheets](https://superuser.com/questions/1359731/how-to-create-a-supply-demand-style-chart).
Let’s say I absolutely love apples, they’re my favorite food. How much would I be willing to pay for a single apple? You might say “$1, that’s the price in the supermarket,” and in many ways you’d be right. If I walk into supermarket A, see apples on sale for $50, and know that I can buy them at supermarket B for $1, I’ll almost certainly leave A and go buy at B.
But that’s not what I mean. What I mean is: how high would the price of apples have to go *everywhere* so that I’d no longer be willing to buy a single apple? This is a purely personal, subjective opinion. It’s impacted by how much money I have available, other expenses I need to cover, and how much I like apples. But let’s say the number is $5.
How much would I be willing to pay for another apple? Maybe another $5. But how much am I willing to pay for the 1,000th apple? 10,000th? At some point, I’ll get sick of apples, or run out of space to keep the apples, or not be able to eat, cook, and otherwise preserve all those apples before they rot.
The point being: I’ll be progressively willing to spend less and less money for each apple. This form of analysis is called *marginal benefit*: how much benefit (expressed as dollars I’m willing to spend) will I receive from each apple? This is a downward sloping function: for each additional apple I buy (quantity demanded), the price I’m willing to pay goes down. This is what gives my personal *demand curve*. And if we aggregate demand curves across all market participants (meaning: everyone interested in buying apples), we end up with something like this:
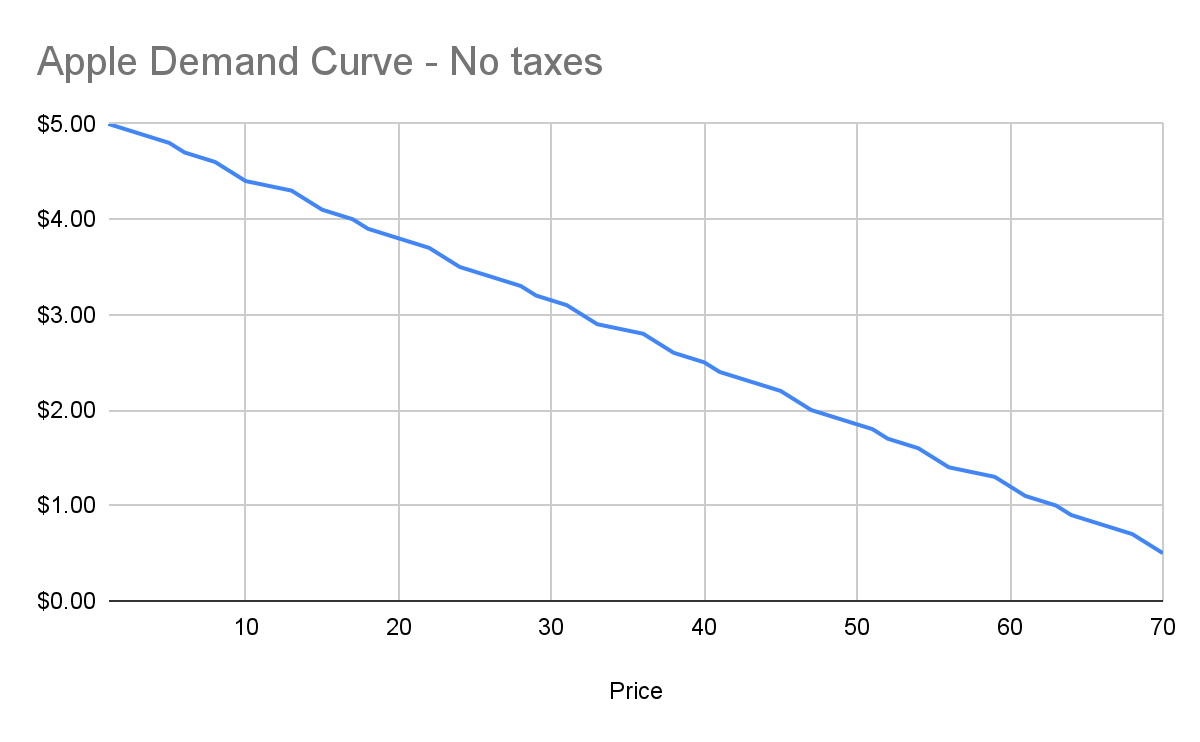
Assuming no changes in people’s behavior and other conditions in the market, this chart tells us how many apples will be purchased by our buyers at each price point between $0.50 and $5. And ceteris paribus (all else being equal), this will continue to be the demand curve for apples.
## Marginal cost
Demand is half the story of economics. The other half is supply, or: how many apples will I sell at each price point? Supply curves are upward sloping: the higher the price, the more a person or company is willing and able to sell a product.
Let’s understand why. Suppose I have an apple orchard. It’s a large property right next to my house. With about 2 minutes of effort, I can walk out of my house, find the nearest tree, pick 5 apples off the tree, and call it a day. 5 apples for 2 minutes of effort is pretty good, right?
Yes, there was all the effort necessary to buy the land, and plant the trees, and water them… and a bunch more than I likely can’t even guess at. We’re going to ignore all of that for our analysis, because for short-term supply-and-demand movement, we can ignore these kinds of *sunk costs*. One other simplification: in reality, supply curves often start descending before ascending. This accounts for achieving efficiencies of scale after the first number of units purchased. But since both these topics are unneeded for understanding taxes, I won’t go any further.
Anyway, back to my apple orchard. If someone offers me $0.50 per apple, I can do 2 minutes of effort and get $2.50 in revenue, which equates to a $75/hour wage for me. I’m more than happy to pick apples at that price\!
However, let’s say someone comes to buy 10,000 apples from me instead. I no longer just walk out to my nearest tree. I’m going to need to get in my truck, drive around, spend the day in the sun, pay for gas, take a day off of my day job (let’s say it pays me $70/hour). The costs go up significantly. Let’s say it takes 5 days to harvest all those apples myself, it costs me $100 in fuel and other expenses, and I lose out on my $70/hour job for 5 days. We end up with:
* Total expenditure: $100 \+ $70 \* 8 hours a day \* 5 days \== $2900
* Total revenue: $5000 (10,000 apples at $0.50 each)
* Total profit: $2100
So I’m still willing to sell the apples at this price, but it’s not as attractive as before. And as the number of apples purchased goes up, my costs keep increasing. I’ll need to spend more money on fuel to travel more of my property. At some point I won’t be able to do the work myself anymore, so I’ll need to pay others to work on the farm, and they’ll be slower at picking apples than me (less familiar with the property, less direct motivation, etc.). The point being: at some point, the number of apples can go high enough that the $0.50 price point no longer makes me any money.
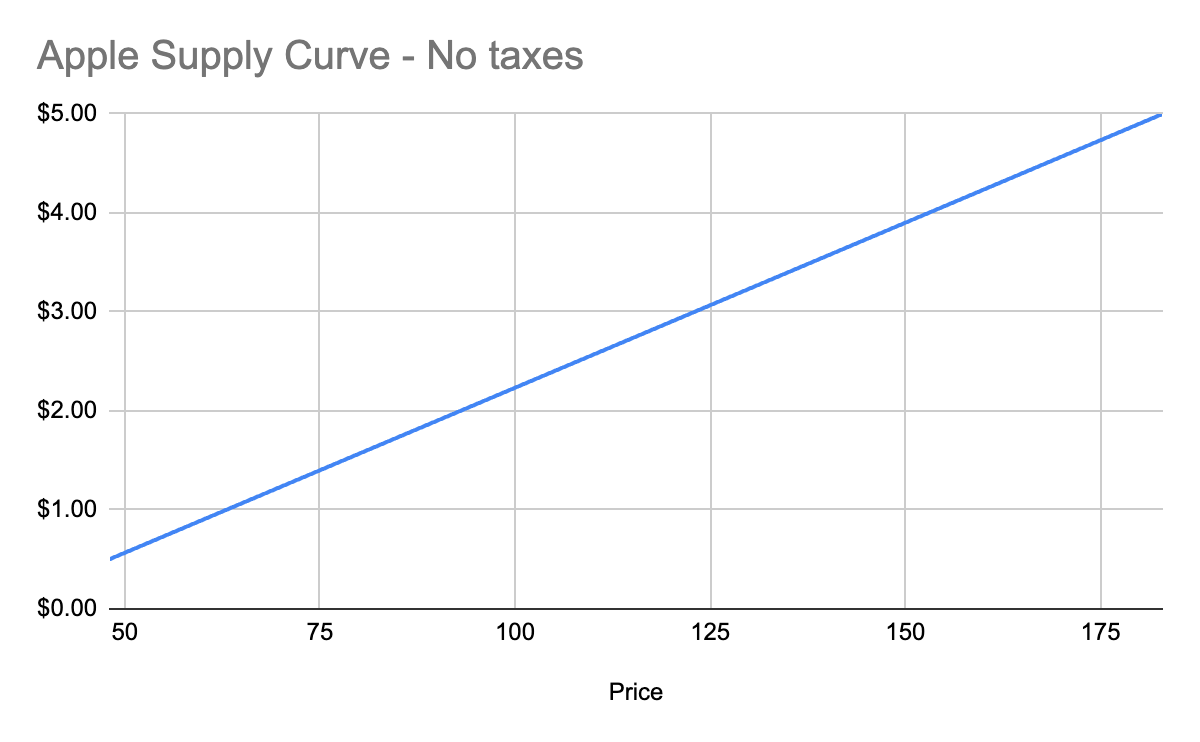
This kind of analysis is called *marginal cost*. It refers to the additional amount of expenditure a seller has to spend in order to produce each additional unit of the good. Marginal costs go up as quantity sold goes up. And like demand curves, if you aggregate this data across all sellers, you get a supply curve like this:
## Equilibrium price
We now know, for every price point, how many apples buyers will purchase, and how many apples sellers will sell. Now we find the equilibrium: where the supply and demand curves meet. This point represents where the marginal benefit a buyer would receive from the next buyer would be less than the cost it would take the next seller to make it. Let’s see it in a chart:
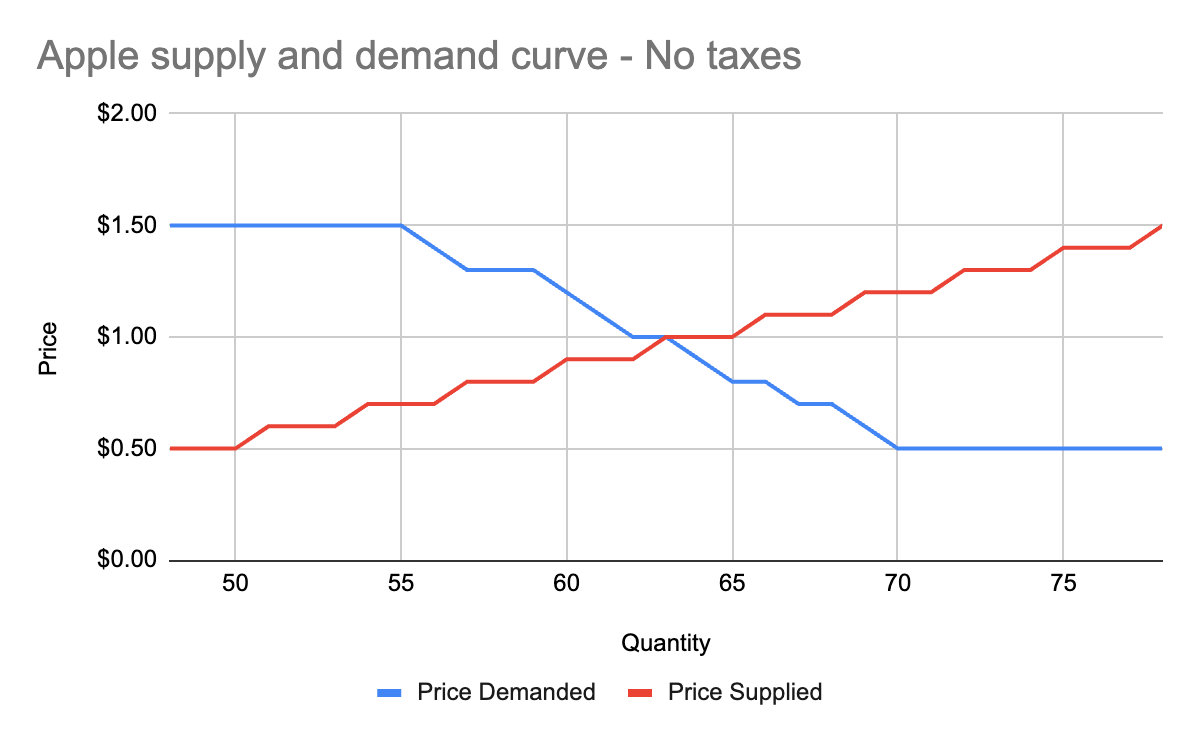
You’ll notice that these two graphs cross at the $1 price point, where 63 apples are both demanded (bought by consumers) and supplied (sold by producers). This is our equilibrium price. We also have a visualization of the *surplus* created by these trades. Everything to the left of the equilibrium point and between the supply and demand curves represents surplus: an area where someone is receiving something of more value than they give. For example:
* When I bought my first apple for $1, but I was willing to spend $5, I made $4 of consumer surplus. The consumer portion of the surplus is everything to the left of the equilibrium point, between the supply and demand curves, and above the equilibrium price point.
* When a seller sells his first apple for $1, but it only cost $0.50 to produce it, the seller made $0.50 of producer surplus. The producer portion of the surplus is everything to the left of the equilibrium point, between the supply and demand curves, and below the equilibrium price point.
Another way of thinking of surplus is “every time someone got a better price than they would have been willing to take.”
OK, with this in place, we now have enough information to figure out how to price in the tariff, which we’ll treat as a negative externality.
## Modeling taxes
Alright, the government has now instituted a $0.50 tariff on every apple sold within the US by a foreign producer. We can generally model taxes by either increasing the marginal cost of each unit sold (shifting the supply curve up), or by decreasing the marginal benefit of each unit bought (shifting the demand curve down). In this case, since only some of the producers will pay the tax, it makes more sense to modify the supply curve.
First, let’s see what happens to the foreign seller-only supply curve when you add in the tariff:
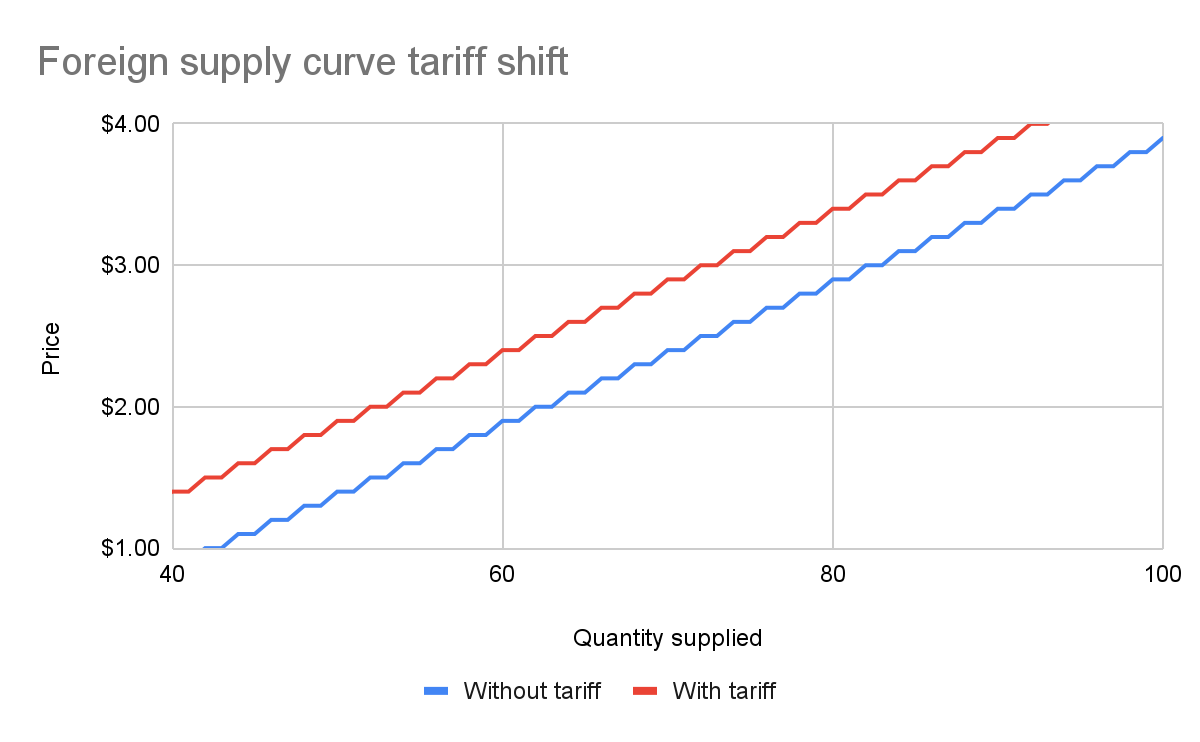
With the tariff in place, for each quantity level, the price at which the seller will sell is $0.50 higher than before the tariff. That makes sense: if I was previously willing to sell my 82nd apple for $3, I would now need to charge $3.50 for that apple to cover the cost of the tariff. We see this as the tariff “pushing up” or “pushing left” the original supply curve.
We can add this new supply curve to our existing (unchanged) supply curve for domestic-only sellers, and we end up with a result like this:
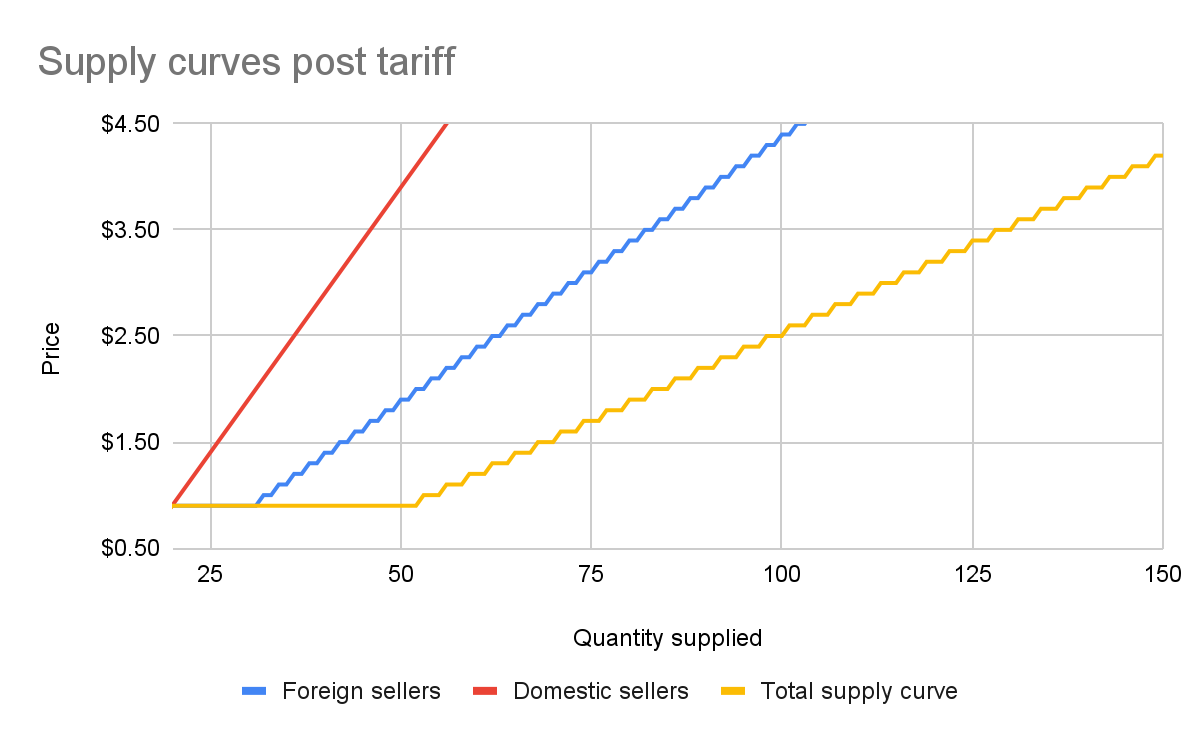
The total supply curve adds up the individual foreign and domestic supply curves. At each price point, we add up the total quantity each group would be willing to sell to determine the total quantity supplied for each price point. Once we have that cumulative supply curve defined, we can produce an updated supply-and-demand chart including the tariff:
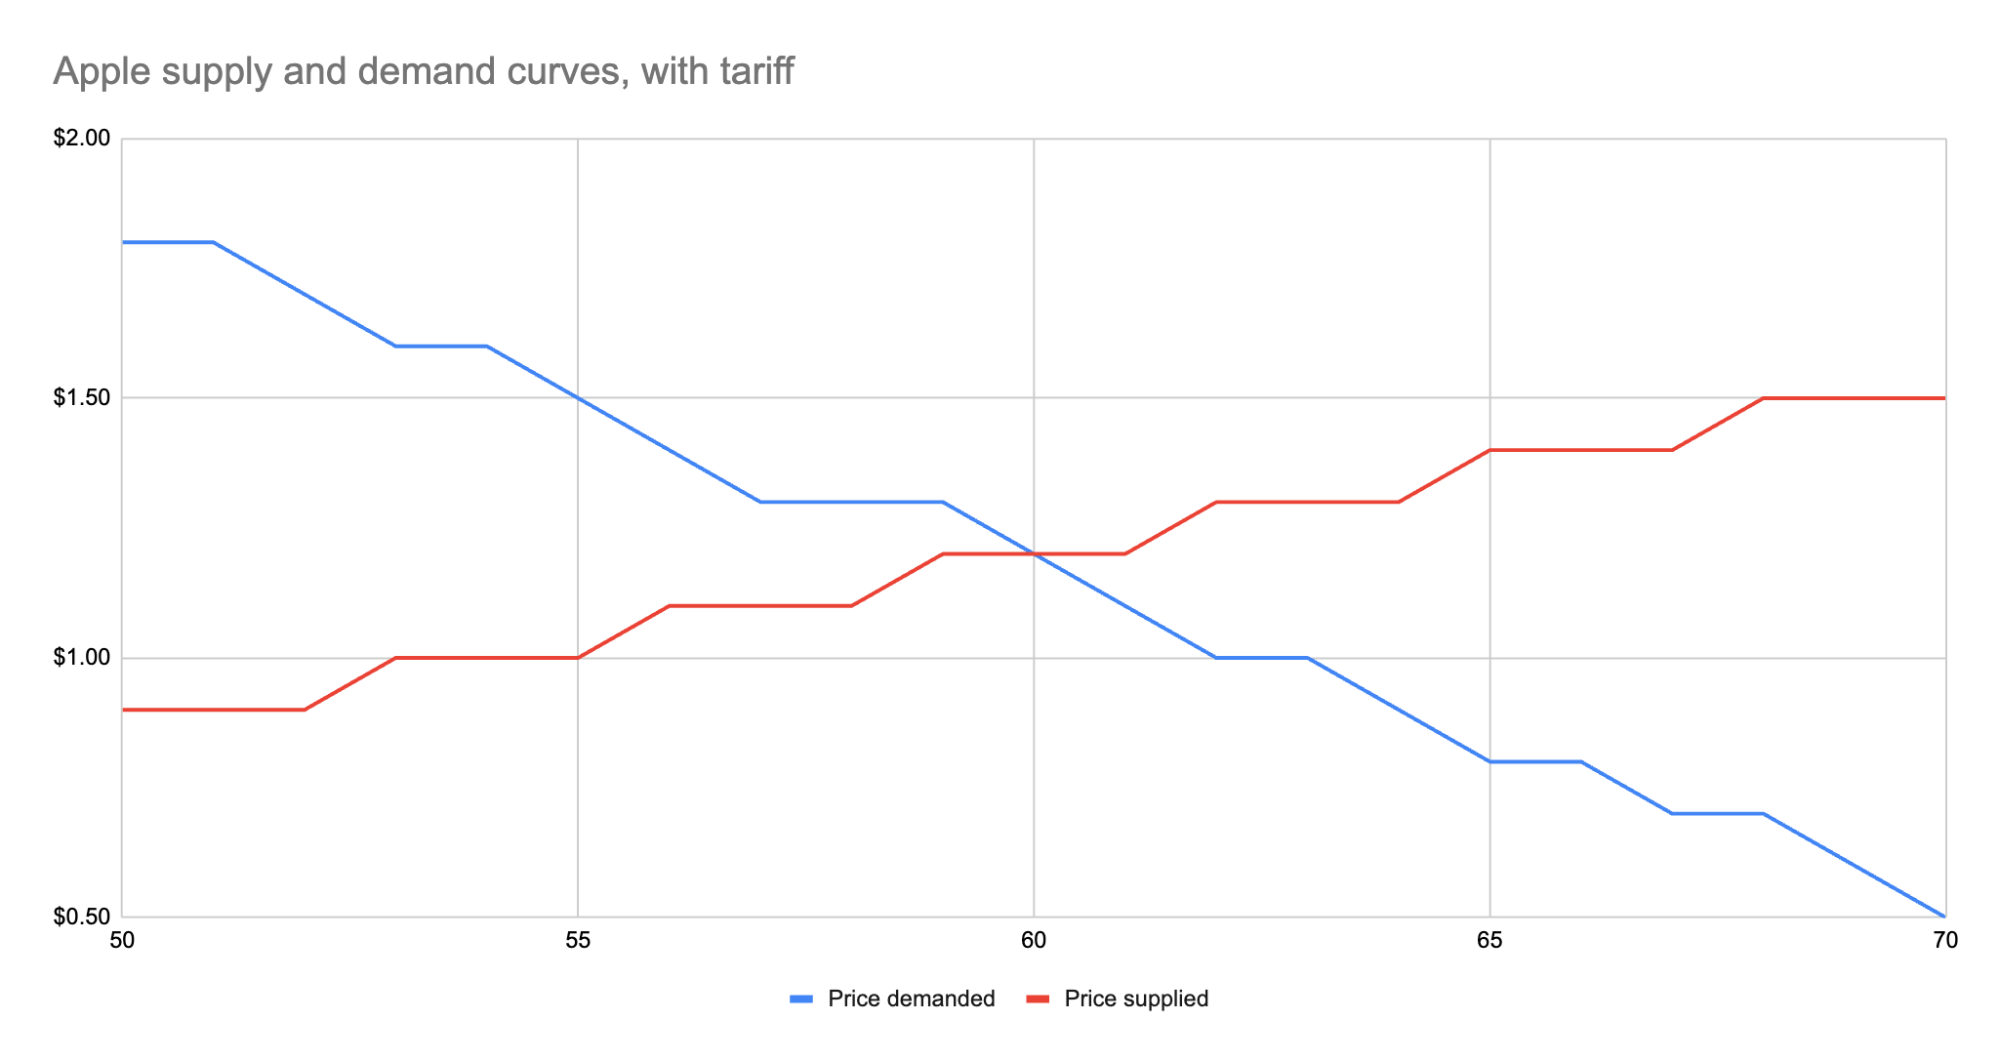
As we can see, the equilibrium has shifted:
* The equilibrium price paid by consumers has risen from $1 to $1.20.
* The total number of apples purchased has dropped from 63 apples to 60 apples.
* Consumers therefore received 3 less apples. They spent $72 for these 60 apples, whereas previously they spent $63 for 3 more apples, a definite decrease in consumer surplus.
* Foreign producers sold 36 of those apples (see the raw data in the linked Google Sheet), for a gross revenue of $43.20. However, they also need to pay the tariff to the US government, which accounts for $18, meaning they only receive $25.20 post-tariff. Previously, they sold 42 apples at $1 each with no tariff to be paid, meaning they took home $42.
* Domestic producers sold the remaining 24 apples at $1.20, giving them a revenue of $28.80. Since they don’t pay the tariff, they take home all of that money. By contrast, previously, they sold 21 apples at $1, for a take-home of $21.
* The government receives $0.50 for each of the 60 apples sold, or in other words receives $30 in revenue it wouldn’t have received otherwise.
We could be more specific about the surpluses, and calculate the actual areas for consumer surplus, producer surplus, inefficiency from the tariff, and government revenue from the tariff. But I won’t bother, as those calculations get slightly more involved. Instead, let’s just look at the aggregate outcomes:
* Consumers were unquestionably hurt. Their price paid went up by $0.20 per apple, and received less apples.
* Foreign producers were also hurt. Their price received went down from the original $1 to the new post-tariff price of $1.20, minus the $0.50 tariff. In other words: foreign producers only receive $0.70 per apple now. This hurt can be mitigated by shifting sales to other countries without a tariff, but the pain will exist regardless.
* Domestic producers scored. They can sell less apples and make more revenue doing it.
* And the government walked away with an extra $30.
Hopefully you now see the answer to the original questions. Importantly, while the government imposed a $0.50 tariff, neither side fully absorbed that cost. Consumers paid a bit more, foreign producers received a bit less. The exact details of how that tariff was split across the groups is mediated by the relevant supply and demand curves of each group. If you want to learn more about this, the relevant search term is “price elasticity,” or how much a group’s quantity supplied or demanded will change based on changes in the price.
## Other taxes
Most taxes are some kind of a tax on trade. Tariffs on apples is an obvious one. But the same applies to income tax (taxing the worker for the trade of labor for money) or payroll tax (same thing, just taxing the employer instead). Interestingly, you can use the same model for analyzing things like tax incentives. For example, if the government decided to subsidize domestic apple production by giving the domestic producers a $0.50 bonus for each apple they sell, we would end up with a similar kind of analysis, except instead of the foreign supply curve shifting up, we’d see the domestic supply curve shifting down.
And generally speaking, this is what you’ll *always* see with government involvement in the economy. It will result in disrupting an existing equilibrium, letting the market readjust to a new equilibrium, and incentivization of some behavior, causing some people to benefit and others to lose out. We saw with the apple tariff, domestic producers and the government benefited while others lost.
You can see the reverse though with tax incentives. If I give a tax incentive of providing a deduction (not paying income tax) for preschool, we would end up with:
* Government needs to make up the difference in tax revenue, either by raising taxes on others or printing more money (leading to inflation). Either way, those paying the tax or those holding government debased currency will pay a price.
* Those people who don’t use the preschool deduction will receive no benefit, so they simply pay a cost.
* Those who do use the preschool deduction will end up paying less on tax+preschool than they would have otherwise.
This analysis is fully amoral. It’s not saying whether providing subsidized preschool is a good thing or not, it simply tells you where the costs will be felt, and points out that such government interference in free economic choice does result in inefficiencies in the system. Once you have that knowledge, you’re more well educated on making a decision about whether the costs of government intervention are worth the benefits.